Working with napari
napari is the viewer where your images and analysis results appear. The
Data Browser is a widget that shows up on the right side of your napari window. This widget
(part of biopb-mcp) connects napari to a data server so you, and your agent, can browse and
open data.
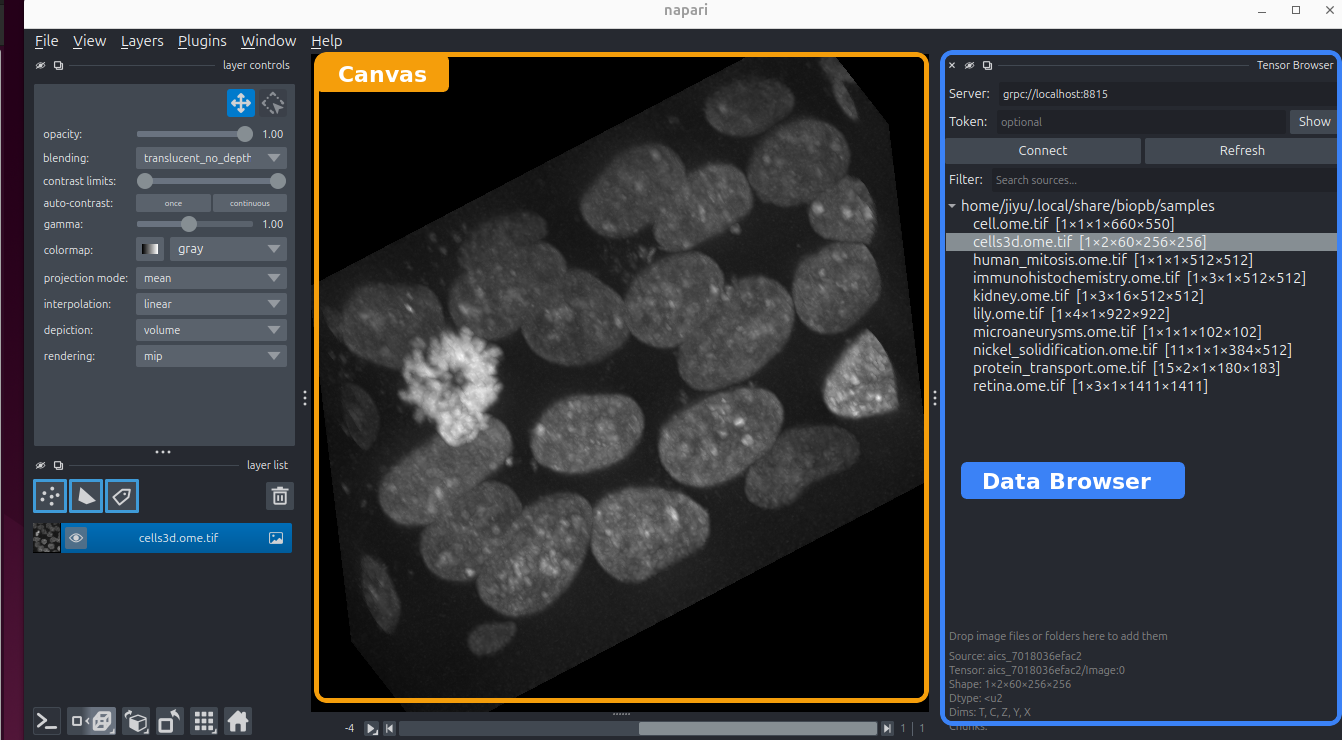
Data Browser
The Data Browser is the workspace where your image data appears. To open a source that's already listed, right-click it and open it as a napari image layer.
Reading data is lazy, which means opening a huge multi-dimensional image does not read all pixels into memory. Instead, data streams in as you scroll through Z, time, or channels, and only the planes you actually view are fetched.
To add a new dataset, simply drag a file or folder from your file manager onto the Data Browser, and the data server registers it on the spot — no restart. The drop runs through the same reader pipeline as a watched directory, so you can drop the same formats the server reads.
Note
Only local files and folders can be dropped this way. To serve data from a shared store or a remote machine, see Data servers.
A shared canvas with your agent
The viewer you're looking at is the same session your agent drives. When the agent runs a segmentation, the result appears as a new layer in front of you. You can:
- adjust contrast, colormaps, and visibility,
- edit labels or draw shapes by hand,
- and ask the agent to read your edits back and keep going.
Image results land here in the viewer; numbers and tables go to the agent's chat. You decide what becomes a saved file — use napari's normal save/export to keep a layer or result.
Doing things yourself
You don't have to go through the agent for everything. The Data Browser and napari work as a normal viewer, so you can open data, pan and zoom, and inspect layers directly whenever you like. The agent is there for the analysis you'd rather describe than click through.
You can go further: run the whole viewer yourself with no agent attached, and extend it with your own napari plugins.
Starting the viewer without an agent
Normally your agent starts biopb and brings up napari for you. You can do the same by hand — useful when you just want to browse data, or when no agent is running.
In a terminal, run:
That opens the napari window with the Data Browser attached — the same viewer an agent would
drive, only there's no agent on the other end. It runs in the foreground and keeps going until
you press Ctrl-C or close the window.
From here napari is entirely yours: open sources from the Data Browser, edit layers, save results.
This viewer is yours alone
Each agent session gets its own viewer and kernel, so an agent you start later won't
attach to this window — it opens its own. biopb mcp view is for browsing by hand, not
for sharing a canvas with an agent.
Adding your own napari plugins
biopb installs everything into a single, isolated environment (a uv
tool named biopb), so a plugin you pip install into your system Python won't be visible to
the viewer. Install it into biopb's own environment instead:
For example, swap <napari-plugin> for napari-animation. Then restart the kernel so
napari re-scans its plugins — from your session's observe view → Restart
kernel, or just ask your agent. (If you're running biopb mcp view, stop it with Ctrl-C
and start it again.) The new plugin appears under napari's Plugins menu.
Upgrades reset the environment
Upgrading or reinstalling biopb re-syncs this environment to biopb's own package list, so
manually added plugins are dropped. Re-run the uv pip install above after an upgrade to
bring them back.
The detection/processing widgets are developer tools
The napari that comes with biopb also ships a couple of algorithm widgets. These are useful for people who want to test their own deployment of algorithm servers — for most users these can be ignored safely.